LMU-DCOM tracks student performance and post-graduation outcomes very closely in accordance with Commission on Osteopathic College Accreditation (COCA) standards . Please click the titles or +/- to expand or collapse each section:

LMU-DCOM tracks student performance and post-graduation outcomes very closely in accordance with Commission on Osteopathic College Accreditation (COCA) standards . Please click the titles or +/- to expand or collapse each section:
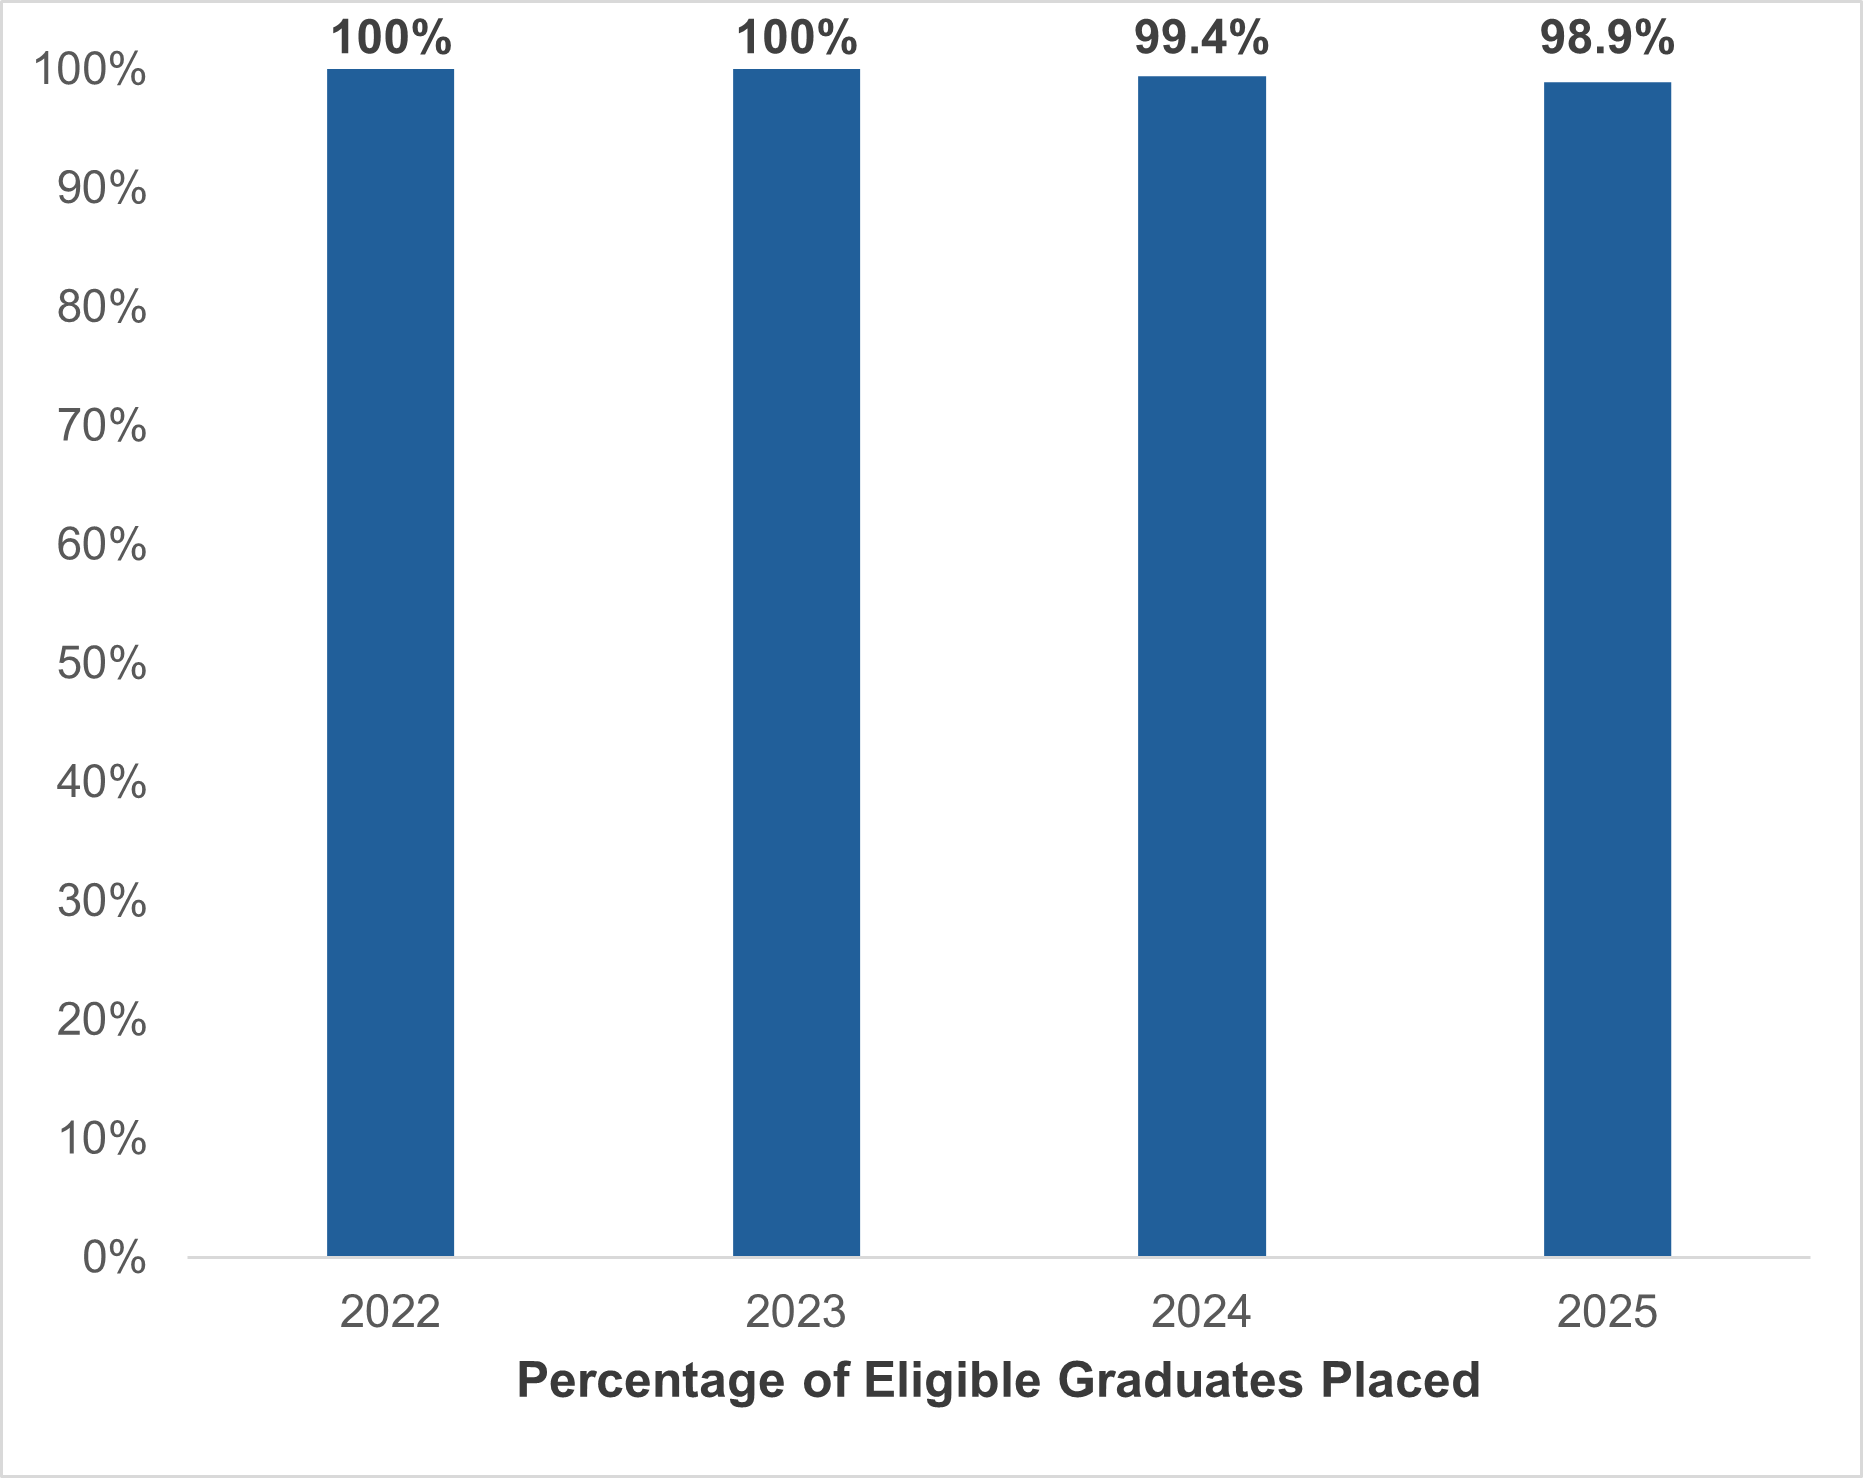
Over the past 4 years, 99.5% of eligible LMU-DCOM graduates were placed into Graduate Medical Education Programs.
|
|
2022 |
2023 |
2024 |
2025 |
4-Year Avg |
|
Number of Eligible Graduates |
228 |
316 |
338 |
367 |
312.25 |
|
Percentage of Eligible Graduates Participating |
100% | 100% | 99.7% | 99.5% | 99.9% |
|
Participants Placed in Residency/Internship |
228 | 316 | 336 | 363 | 310.75 |
|
Percentage of Eligible Graduates Placed |
100% | 100% | 99.4% | 98.9% | 99.5% |
For additional information information regarding student GME Placement Rates, please contact the Dean of Student Affairs at the address below:
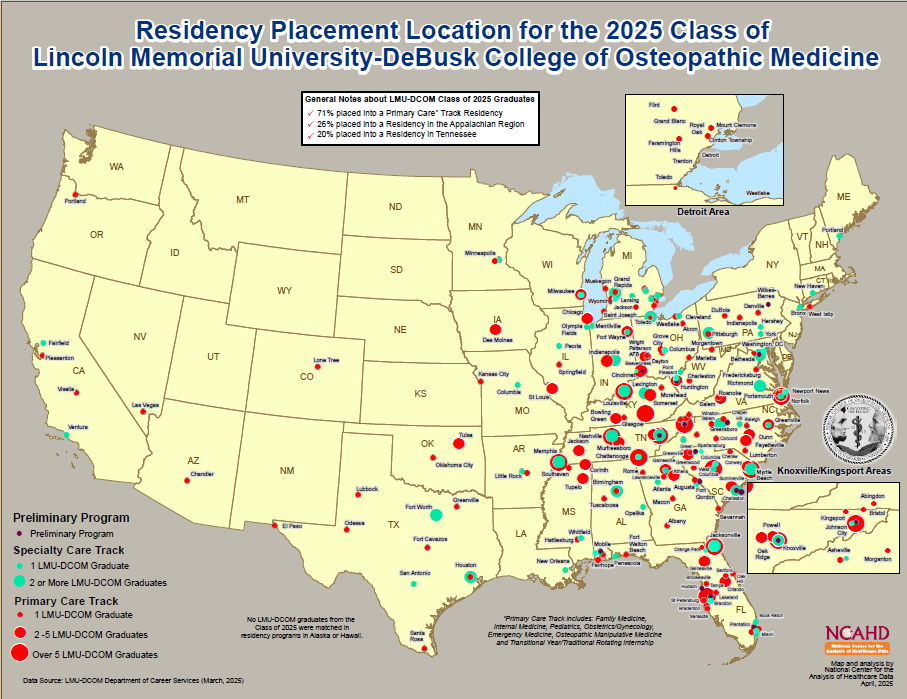
Class of 2025 Residency Placement by Location | Class of 2025 Residency Placement Map
Class of 2024 Residency Placement by Location | Class of 2024 Residency Placement Map
Class of 2023 Residency Placement by Location | Class of 2023 Residency Placement Map
Class of 2022 Residency Placement by Location | Class of 2022 Residency Placement Map
Class of 2021 Residency Placement by Location | Class of 2021 Residency Placement Map
Class of 2020 Residency Placement by Location | Class of 2020 Residency Placement Map
Class of 2019 Residency Placement by Location | Class of 2019 Residency Placement Map
Class of 2018 Residency Placement by Location | Class of 2018 Residency Placement Map
Class of 2017 Residency Placement by Location | Class of 2017 Residency Placement Map
Class of 2016 Residency Placement by Location | Class of 2016 Residency Placement Map
Class of 2015 Residency Placement by Location | Class of 2015 Residency Placement Map
Class of 2014 Residency Placement by Location | Class of 2014 Residency Placement Map
Class of 2013 Residency Placement by Location | Class of 2013 Residency Placement Map
Class of 2012 Residency Placement by Location | Class of 2012 Residency Placement Map
Class of 2011 Residency Placement by Location | Class of 2011 Residency Placement Map
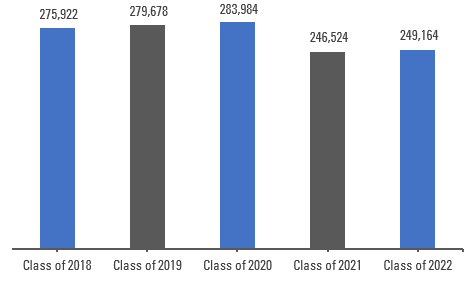
The calculation for graduate indebtedness is based on the loans to cover the costs of tuition, living, books, and supplies incurred during the 4-year program. The average indebtedness does not exceed the eligible maximum loan amounts.
| Graduating Cohort | Average Indebtedness |
|---|---|
|
Class of 2022 |
$249,164 |
|
Class of 2021 |
$246,524* |
|
Class of 2020 |
$283,984 |
|
Class of 2019 |
$279,678 |
|
Class of 2018 |
$275,922 |
*The reported debt load for LMU-DCOM graduates decreased significantly in 2021 due to a change in how graduate indebtedness is calculated. Starting with the class of 2021, LMU-DCOM is reporting only the total amount of money borrowed (on average) per student while attending DCOM. This new calculation aligns with standard osteopathic medical school reporting.
| Year Entering Repayment | N | Defaults within the first three years of repayment | Default Rate |
|---|---|---|---|
|
2018 |
265 |
4 |
1.5% |
|
2017 |
249 |
2 |
0.8% |
|
2016 |
197 |
1 |
0.5% |
|
2015 |
150 |
2 |
1.3% |
| Incoming Cohort | Cohort Size | 4-year Completion Rate | 5-year Completion Rate | 6-year Completion Rate |
| Fall 2017 | 243 | 74.5% | 86.4% | 88.5% |
| Fall 2018 | 243 | 79.0% | 88.1% | 88.9% |
| Fall 2019 | 368 | 79.6% | 87.0% | 88.6% |
| Fall 2020 | 393 | 77.7% | 88.1% | |
| Fall 2021 | 418 | 76.3% |
| Incoming Cohort | Cohort Size | Retention Rate |
| Fall 2021 | 418 | 88% |
| Fall 2022 | 443 | 91% |
| Fall 2023 | 459 | 93% |
| Fall 2024 | 459 | 95% |
| Retention Rate is defined as the school's percentage of first-time enrolling students who continue at LMU-DCOM year to year. | ||